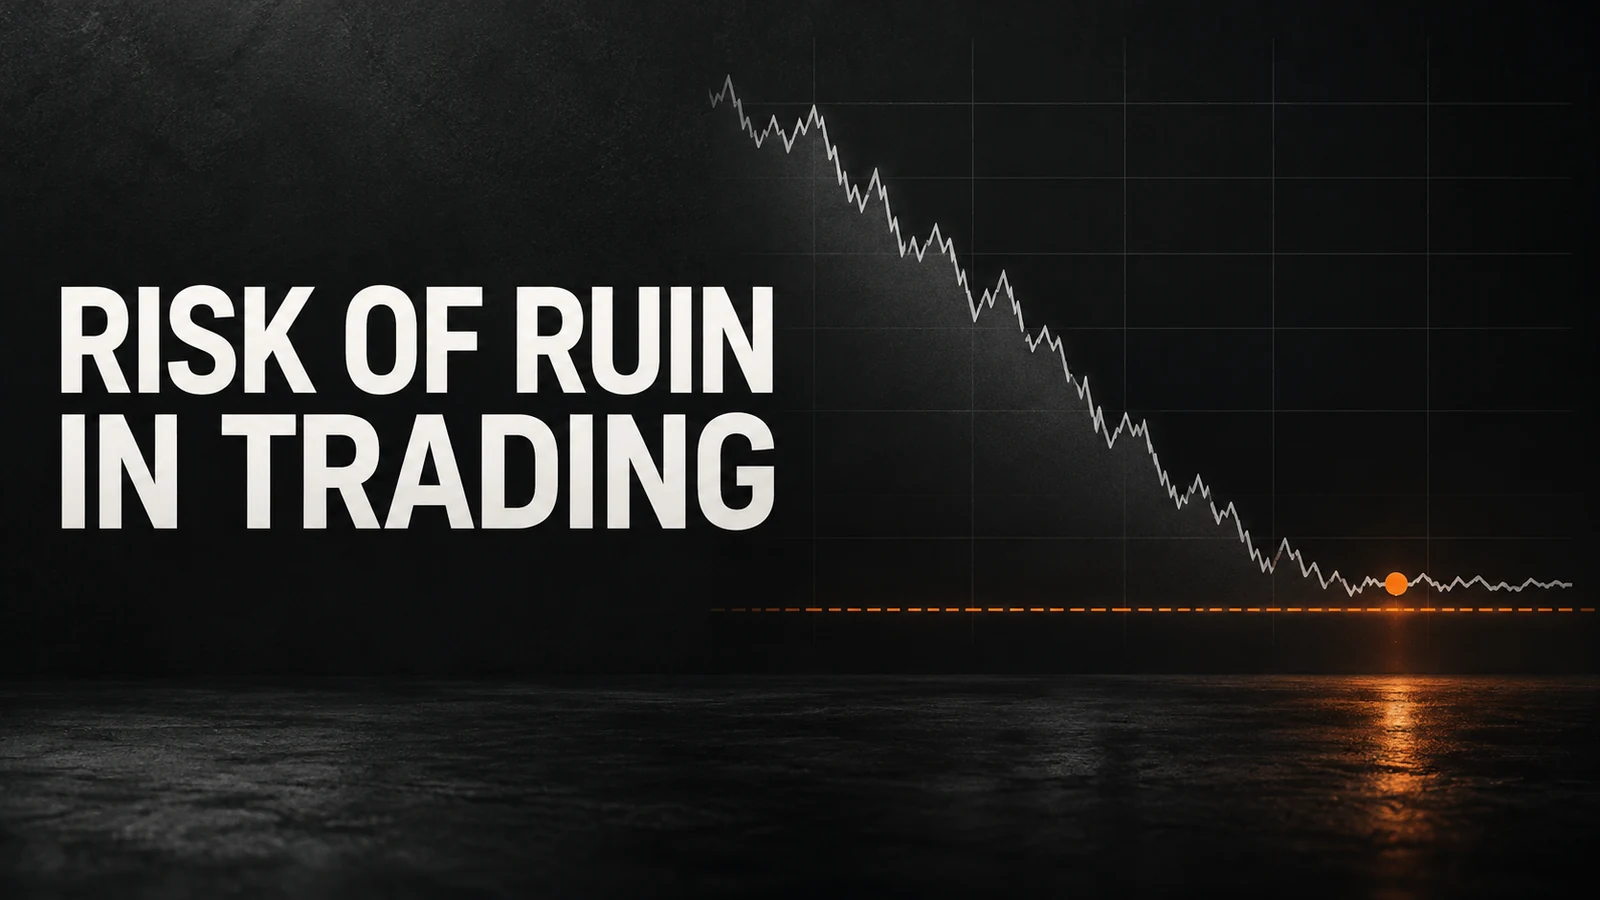



Risk of ruin in trading is the estimated probability that a strategy reaches a defined failure threshold before it recovers. For a personal account, ruin may mean a chosen capital floor. For a prop account, the relevant threshold is often a Daily Loss or Maximum Loss breach rather than a zero balance. The estimate changes with win rate, payoff, risk per trade and the sequence of outcomes.
Risk of ruin is not a prediction that an account will fail. It is a conditional estimate: if the inputs and assumptions are reasonable, how vulnerable is the trading process to an adverse sequence?
That distinction matters for funded traders. A strategy can have positive trading expectancy and still fail because the account cannot survive its normal losing streaks.
Risk of Ruin Definition
Start by defining ruin. A retail trader may define ruin as losing 30% of deposited capital or reaching a minimum cash level. A prop trader should define it as reaching the applicable failure boundary, because the account can close while most of the displayed balance still remains.
| Context | Possible ruin threshold | Why the definition matters |
|---|---|---|
| Personal retail account | Chosen capital floor or margin liquidation | The trader controls when to stop before forced liquidation |
| Prop evaluation | Daily or Maximum Loss breach | The account may fail before the strategy’s long-run edge appears |
| Funded-stage account | Loss-rule or conduct breach | Account access and payout eligibility can end |
| Personal risk plan | Internal stop inside the hard boundary | Creates room for costs, slippage and calculation uncertainty |
Risk-of-Ruin Formula and Assumptions
A simple approximation sometimes used for repeated, fixed-size outcomes is:
Risk of Ruin ≈ ((1 − E) ÷ (1 + E))U
In this simplified model, E is positive expectancy expressed per fixed risk unit and U is the number of full risk units between current equity and the defined failure threshold. The approximation is useful for comparing position sizes under the same assumptions. It is not reliable when outcomes, trade size or market conditions vary materially.
The result depends on assumptions that real trading often violates:
- win probability and average payoff remain stable;
- risk size is fixed and losses do not exceed the planned amount;
- trades are sufficiently independent;
- costs and slippage are already included in results;
- the strategy continues to behave like the historical sample;
- the failure threshold does not move unexpectedly.
Use the formula as a sensitivity tool. For a serious estimate, a Monte Carlo simulation using the strategy’s actual trade distribution is more informative because it can preserve variable winners, losers and costs.
Win Rate, Payoff and Risk Size
Three variables drive most ruin scenarios:
- Win rate: how frequently the strategy wins across a representative sample.
- Payoff ratio: the average net winner compared with the average net loser.
- Risk per trade: how much of the available loss buffer one full loss consumes.
Do not study win rate alone. A 40% win-rate strategy can have positive expectancy if winners are sufficiently larger than losses. A 70% win-rate strategy can still be fragile if occasional losses are much larger than the average winner.
Risk size changes the survival capacity directly:
Loss Units to Failure = Available Loss Buffer ÷ Planned Loss per Trade
| Risk per trade | Full losses to consume 5% | Planning interpretation |
|---|---|---|
| 0.25% | 20 | More room for variance, but target progress is slower |
| 0.50% | 10 | Moderate room if losses do not cluster or exceed stops |
| 1.00% | 5 | A normal streak can approach the hard boundary quickly |
| 2.00% | 2.5 | One sequence or gap can dominate the account outcome |
This is a capacity illustration, not permission to trade until the entire buffer is used. Daily limits, correlated positions, commissions and open loss can reduce the usable room.
Losing-Streak Probability
If the probability of a loss is q, the probability that one specified sequence contains n consecutive losses is:
P(n specified losses) = qn
With a 45% loss probability, five specified losses have a probability of about 1.85%. That does not mean a five-loss streak has only a 1.85% chance of appearing during a long trading year. A longer sample contains many possible starting points, so the probability of seeing at least one streak is higher.
| Consecutive losses | qn | Loss at 0.5% risk each |
|---|---|---|
| 3 | 9.11% | 1.5% before compounding and costs |
| 5 | 1.85% | 2.5% before compounding and costs |
| 7 | 0.37% | 3.5% before compounding and costs |
| 10 | 0.034% | 5.0% before compounding and costs |
Use losing-streak scenarios to test whether a risk plan can survive ordinary variance. Do not respond to a streak by increasing size to recover faster; that changes the assumptions and can turn a manageable sequence into a breach.
Drawdown Probability vs Account Breach
Drawdown and ruin are related but not identical. A 4% drawdown may be uncomfortable in a personal account but terminal in an account with a tighter applicable rule. A daily breach can also occur even when the full account drawdown remains modest.
Build the model around the actual account mechanics:
- the Daily Loss reference value and reset time;
- whether floating P&L, commissions and swaps are included;
- whether Maximum Loss is static or trailing;
- the number of correlated positions that can lose together;
- the gap between a personal stop and the hard boundary.
Review the drawdown-rules guide before converting a percentage into available risk units.
How to Reduce Risk of Ruin
- Reduce risk per trade. This increases the number of losses the buffer can absorb.
- Cap correlated exposure. Several trades based on one market idea can behave like one oversized position.
- Use a personal daily stop. Stop before the firm’s hard Daily Loss boundary.
- Include costs. Commission, swap and slippage reduce realised expectancy.
- Re-estimate after enough trades. A small sample can overstate win rate or payoff.
- Stress-test worse inputs. Lower the win rate, reduce winners and increase costs before accepting the plan.
Limits of the Model
Risk-of-ruin models are most useful for comparing choices, not producing a single authoritative percentage. Markets change, trades cluster, execution fails and traders alter behaviour. Historical expectancy may also be inflated by one exceptional winner.
Run several scenarios: base, conservative and severe. If the plan is safe only under the optimistic case, the position size is too dependent on favourable assumptions.
Frequently Asked Questions
Risk of ruin is the estimated probability that a trading process reaches a defined failure threshold before it recovers or grows. The threshold may be account depletion, a personal drawdown stop or a prop firm breach limit.
No. Drawdown measures how far equity has fallen from a reference point. Risk of ruin estimates the probability of reaching a chosen failure boundary under stated assumptions about win rate, payoff, trade risk and outcome independence.
For a specified sequence of n losses, a simple probability is q to the power n, where q is the loss probability per trade. The chance of seeing at least one such streak across many trades is higher and requires a sequence model or simulation.
Larger risk per trade reduces the number of full losses the account can absorb before reaching the failure threshold. It also makes recovery mathematically harder because a larger percentage gain is required after a deeper drawdown.
Yes. A positive average expectancy can coexist with long losing streaks, unstable payoff, excessive position size or clustered losses. Expectancy describes an average; it does not guarantee a safe equity path.
Use them as planning scenarios rather than promises. Define the actual breach threshold, model conservative win and payoff assumptions, test several risk sizes and keep a personal stop inside the account's hard loss boundary.