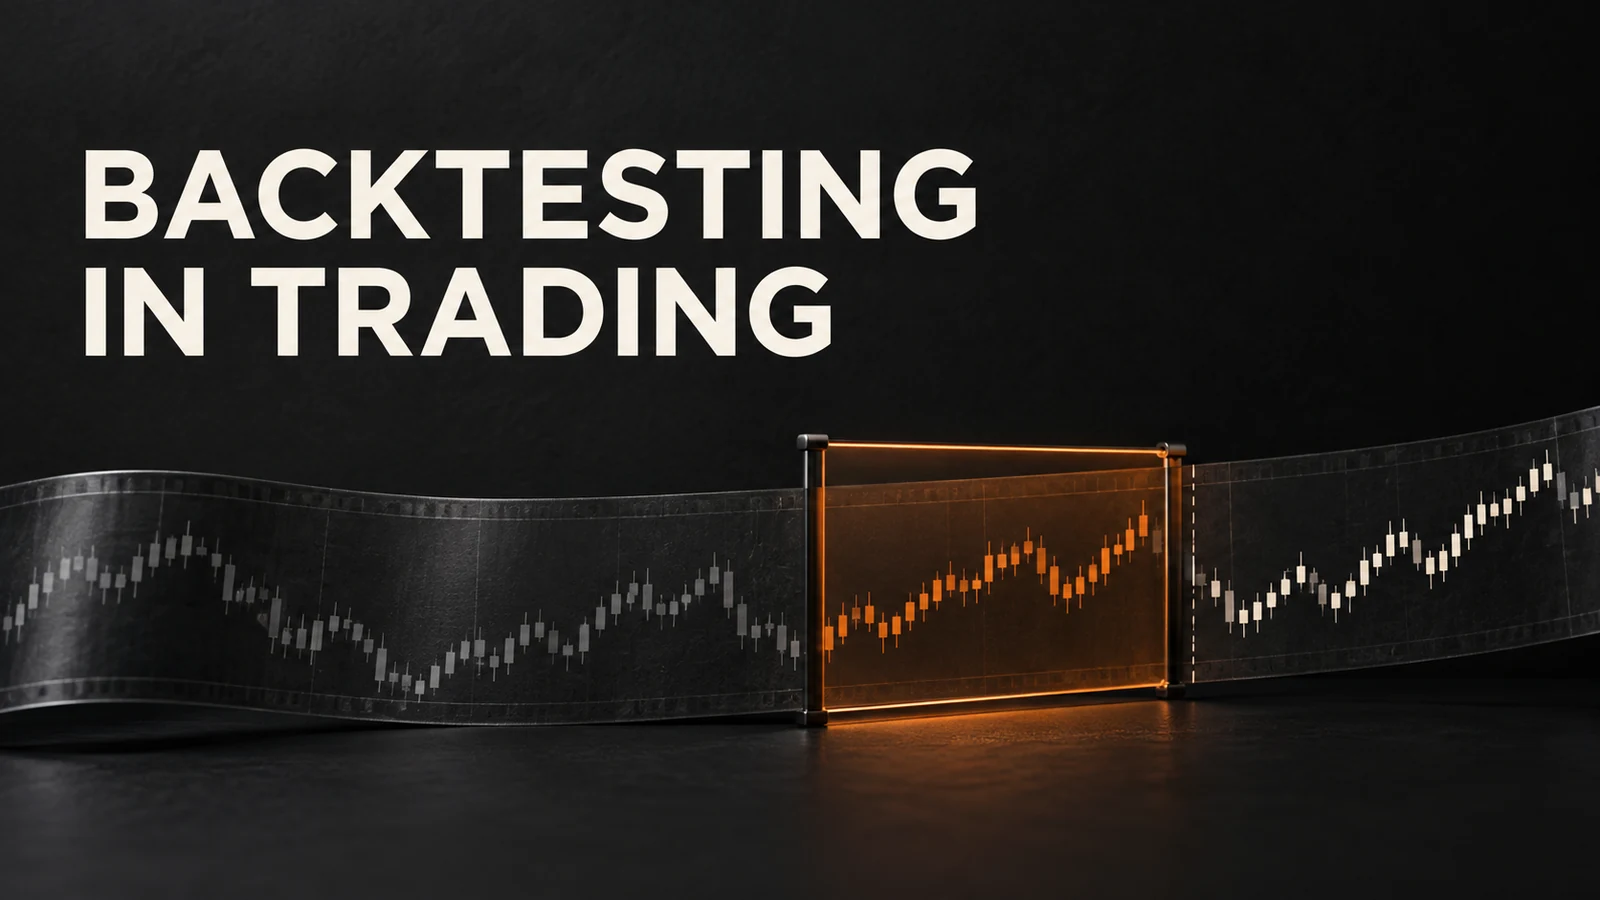



Backtesting in trading means applying a defined strategy to historical market data to estimate how its rules would have performed. A useful backtest includes realistic costs, a representative sample, drawdown and trade-level evidence. It should be followed by out-of-sample and demo validation because historical results do not guarantee future profitability.
A backtest is an experiment. The strategy rules are the hypothesis, historical data is the test environment and the trade log is the evidence. If the rules change while results are being reviewed, the experiment is no longer clean.
What Backtesting Can and Cannot Tell You
A backtest can estimate:
- how often a setup appeared in the selected data;
- the distribution of wins, losses and holding times;
- historical expectancy and drawdown;
- which markets or conditions helped or hurt the rules;
- whether the strategy could fit specific loss and operating constraints.
It cannot prove that the edge will continue, recreate every live fill or measure how a trader will behave under pressure. The result is only as credible as the data, rules and assumptions.
Manual vs Automated Backtesting
| Method | Strength | Weakness | Best use |
|---|---|---|---|
| Manual chart review | Builds pattern recognition and captures visual context | Slow and vulnerable to hindsight bias | Discretionary setups with clear recording rules |
| Replay testing | Hides some future bars and improves sequence discipline | Still depends on manual decisions and platform data | Entry, exit and session practice |
| Automated code | Processes large samples consistently | Can implement a mistaken rule perfectly | Mechanical strategies with explicit logic |
| Hybrid review | Combines scale with chart-level quality checks | Requires a reconciliation process | Most serious strategy validation |
The method should match the strategy. A rule such as “buy after a valid structure shift” is not testable until “valid” is defined. If two reviewers cannot apply the same rule consistently, the backtest may be measuring interpretation rather than strategy.
Data and Assumptions
Record the exact data source, instrument, timeframe, timezone, session and date range. Then document:
- bid, ask or mid-price treatment;
- spread, commission, swap and slippage;
- contract size, tick value and rounding;
- market closures and missing bars;
- entry priority when stop and target occur inside the same bar;
- how pending orders, partial exits and position adjustments are modelled.
A strategy that earns a small gross edge can become negative after realistic execution costs. Test a base cost and a stressed cost rather than using zero.
Key Backtest Metrics
| Metric | Question answered | Common mistake |
|---|---|---|
| Trade count | How much evidence supports the estimate? | Treating a small sample as stable |
| Net expectancy | What is the average result per trade after costs? | Reporting gross profit only |
| Win rate and payoff | How do frequency and size combine? | Using win rate as the whole edge |
| Maximum drawdown | How severe was the worst historical decline? | Assuming the future cannot be worse |
| Losing streak | How long did adverse sequences last? | Increasing size after normal variance |
| Exposure | How much risk was open at once? | Ignoring correlated positions |
| Time in market | How long was capital exposed? | Comparing strategies with different exposure as equals |
Express results in money and in R, where 1R is the planned loss if the stop is reached. R makes results easier to compare across account sizes. Continue with the trading expectancy guide for the calculation.
Look-Ahead Bias, Survivorship Bias and Overfitting
Three errors can make a weak system look strong.
Look-Ahead Bias
The test uses information that was not available at the decision time. Examples include entering at a bar’s close based on the same completed close, or using a higher-timeframe value before that timeframe finished.
Survivorship and Selection Bias
The data includes only instruments that survived or were chosen because their charts looked favourable. Keep the selection rule independent of the later result.
Overfitting
The strategy is adjusted repeatedly until it matches historical noise. Warning signs include many parameters, a narrow profitable setting, dramatic deterioration out of sample and profits concentrated in a small number of trades.
Prefer a simple rule set with a broad stable region over the single best parameter combination.
In-Sample, Out-of-Sample and Walk-Forward Testing
- Design: define the strategy before studying the final test period.
- In-sample: develop and calibrate on one historical segment.
- Out-of-sample: evaluate the frozen rules on unused data.
- Walk-forward: repeat development and validation across sequential windows.
- Forward demo: run the fixed version in current market conditions.
Do not return to the out-of-sample period repeatedly and still call it unused. Once it influences a change, it becomes part of development evidence and another untouched segment is needed.
Costs and Slippage Stress Test
Run at least three execution cases:
| Case | Assumption | Use |
|---|---|---|
| Base | Normal spread, commission and measured slippage | Central planning estimate |
| Stressed | Wider spread and poorer fills | Tests fragile edges |
| Severe | Adverse execution around volatile periods | Shows operational tail risk |
If modestly worse costs remove the edge, the strategy may depend more on the backtest engine than the market.
Add a Prop-Firm Rule Overlay
A profitable backtest can still be incompatible with a prop account. Re-run the historical trade sequence through the intended constraints:
- Daily Loss calculation and reset time;
- static or trailing Maximum Loss;
- maximum simultaneous and correlated exposure;
- holding, instrument and permitted-strategy conditions;
- minimum trading days or payout-period conditions that apply;
- realistic costs and platform behaviour.
Use the current FAQ for the selected account. The risk-of-ruin guide can then test whether the planned position size fits the available failure buffer.
From Backtest to Demo Validation
Freeze the strategy version before demo testing. Keep the same entry, exit, risk and session rules. Record every difference between the backtest and live demo: missed signals, rejected orders, higher costs, delayed decisions and discretionary overrides.
A useful transition sequence is:
- complete the historical test;
- pass an unused historical sample;
- run the fixed version through a 30-day demo plan;
- compare expected and realised frequency, cost and drawdown;
- repeat if the live process differs materially.
Frequently Asked Questions
Backtesting applies a defined trading strategy to historical market data to estimate how the rules would have behaved. It is a simulation based on data and assumptions, not proof of future profitability.
Manual backtesting records rule-based decisions by reviewing charts or replay data. Automated backtesting uses code to process many observations consistently. Both can be biased if rules or data are poor.
There is no universal number. The sample must cover enough valid occurrences and different market conditions to evaluate the strategy's distribution. Rare setups may require more history than frequent strategies.
Include net expectancy, win rate, average winner and loser, maximum drawdown, losing streak, trade count, costs, exposure, time in market and results by setup and market condition.
Overfitting occurs when rules or parameters are tuned so closely to historical noise that the result does not generalise. Too many adjustable conditions, repeated optimisation and weak out-of-sample performance are common warning signs.
Freeze the rules, test a genuinely unused sample, then forward-test the same version in demo with realistic costs and operational constraints. Review differences before risking a paid challenge.